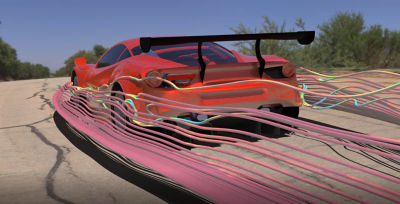
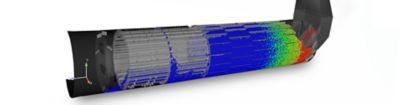
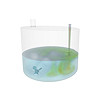
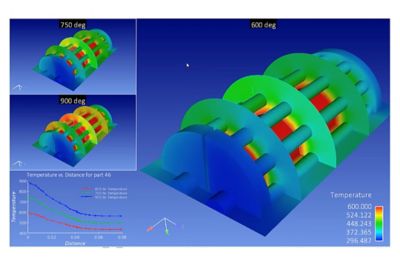
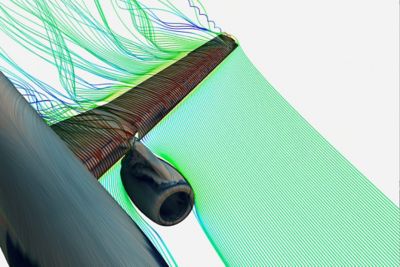
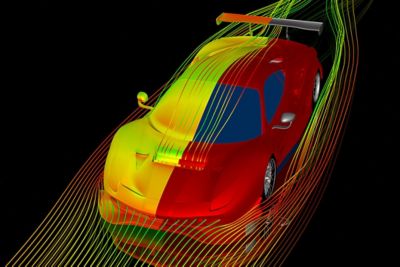
Extreme Visualization
Are you seeing all you should see in your engineering and scientific
postprocessing? If not, then EnSight is the tool for you. With
the largest set of features of any visualization/post-processing tool
in existence, EnSight lets you see what you've been unable to display
and document in the past. An icon-based user interface allows you
to learn the program quickly and to move easily into layers of
increased functionality. Plus, EnSight works on all major
computing platforms and supports interfaces to most major CAE programs
and data formats.
CEI offers several forms of EnSight; these include EnSight Lite,
Standard, Gold and DR (distributed rendering) and are described more on
each product page.
The power of EnSight software includes all the power of EnSight Lite plus the following features:
- Runs standalone or distributed using client-server operation on Windows, Apple, Linux, SGI, SUN, IBM, and HP.
- Reads multiple data sets and enables you to run comparisons
between them. The data can originate from different solvers
and/or different disciplines.
- Runs in parallel on up to 2 processors on shared memory computer systems.
- Post-processes data remotely with client-server operation.
Need more clarification on which visualization product is right for you? Click here for our project comparison chart.
Tutorials
A simple tutorial on how to use EnSight
This tutorial provides a step-by-step demonstration of basic EnSight
operation. After successfully completing this tutorial, you should be
able to start EnSight, read a dataset and load a model, transform
objects in the Graphics Window, reset transformation, work with parts
and change part attributes, save an image to a file, and exit EnSight.
A simple tutorial on how to use EnSight 8.0 specifically for CFD
This tutorial provides step-by-step instructions for performing many
basic postprocessing operations – especially those relevant to
computational fluid dynamic analysis. After successfully completing
this tutorial you should be able to create a clipping plane and display
contours and vector arrows on the plane, move the clipping plane with
the mouse, create an isosurface and change the isovalue interactively,
create a single particle trace and a rake of traces and save an image
of the Graphics Window to a file.
|